Get Free Solar Panel Quotes
Find out how much solar panels would cost you
Do you need solar panels for your home or business?
Fill in our form - Get a free quote - Start saving on energy bills
Why get solar panels?
- Generate free, green electricity
- Reduce your electricity bill by up to 64%
- Get paid for what you don't use
As featured in:


News
The latest news, analysis, guides and opinion.

The most polluted countries in the world
Pollution causes millions of deaths per year, and is the main driver of climate change. Here are the countries it most affects.
-
 PM focused on plug-in solar, not free batteries The government is remaining tight lipped on whether it will eventually offer free plug-in batteries to low-income households.
 -
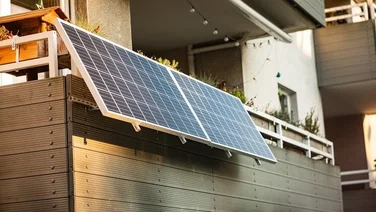 Plug-in solar panels to be available after 27th August Plug-in solar panels will be available from 27th August after the government updated its safety laws.
 -
 ‘Safer’ and ‘longer-lasting’ sodium battery on its way to households UNIGRID have unveiled what they say is a safer and more reliable form of battery, and it's made out of sodium, not lithium.
 -
 Why drilling in the North Sea is a terrible idea Andy Burnham is set to make a decision on North Sea drilling. We say it would be a terrible move to approve new licenses. Here's why.
 -
 Government to hand out free plug-in batteries Batteries that you can plug in to your socket might soon be handed out to low-income households as the govt tries to cut bills
 -
 Plastic bottles could power solar storage batteries and EVs Yes, that's right. Plastic bottles might one day be powering your solar energy system. How? By turning into crystals...sort of.
 -
 Lessons from Germany: what the UK can learn from Europe’s most mature plug-in solar market Germany is the most mature plug-in solar market in the world. With regulations about to be relaxed in the UK what lessons can we learn.
 -
 Andy Burnham to cut VAT on electricity bills on 1st October Andy Burnham has said his government will make electricity cheaper on 1st October.
 -
 The 2026 World Cup emitted as much carbon as Albania The 2026 World Cup emitted about the same amount of carbon as Albania does in a year and more than Rwanda, Western Sahara, and Greenland.

